Cancelling your registration will remove your access to the event. If you proceed, you will no longer be able to participate or access event-related materials.
Deleting your account will remove your access to the event.
The North Dakota Geospatial Summit started out as GIS Day in 2001. In 2005 that event turned into the North Dakota GIS Users Conference. Reflecting the dynamic and widening geospatial field but not losing sight of the foundation continuing to be built upon by geospatial professionals, in 2019 the event was renamed to the North Dakota Geospatial Summit. The North Dakota Geospatial Summit is THE event in North Dakota for you if you can check one or more of these:
If one or more of these apply to you, then be sure to register to attend as a participant and/or sponsor. Please consider submitting an abstract to share with others what you have learned and/or are doing.
The North Dakota Geospatial Summit started out as GIS Day in 2001. In 2005 that event turned into the North Dakota GIS Users Conference. Reflecting the dynamic and widening geospatial field but not losing sight of the foundation continuing to be built upon by geospatial professionals, in 2019 the event was renamed to the North Dakota Geospatial Summit.
The North Dakota Geospatial Summit is THE event in North Dakota for you if you can check one or more of these:
Download the Geospatial Summit App! |
||||
|
Apple App Store |
Google Play Store |
|||
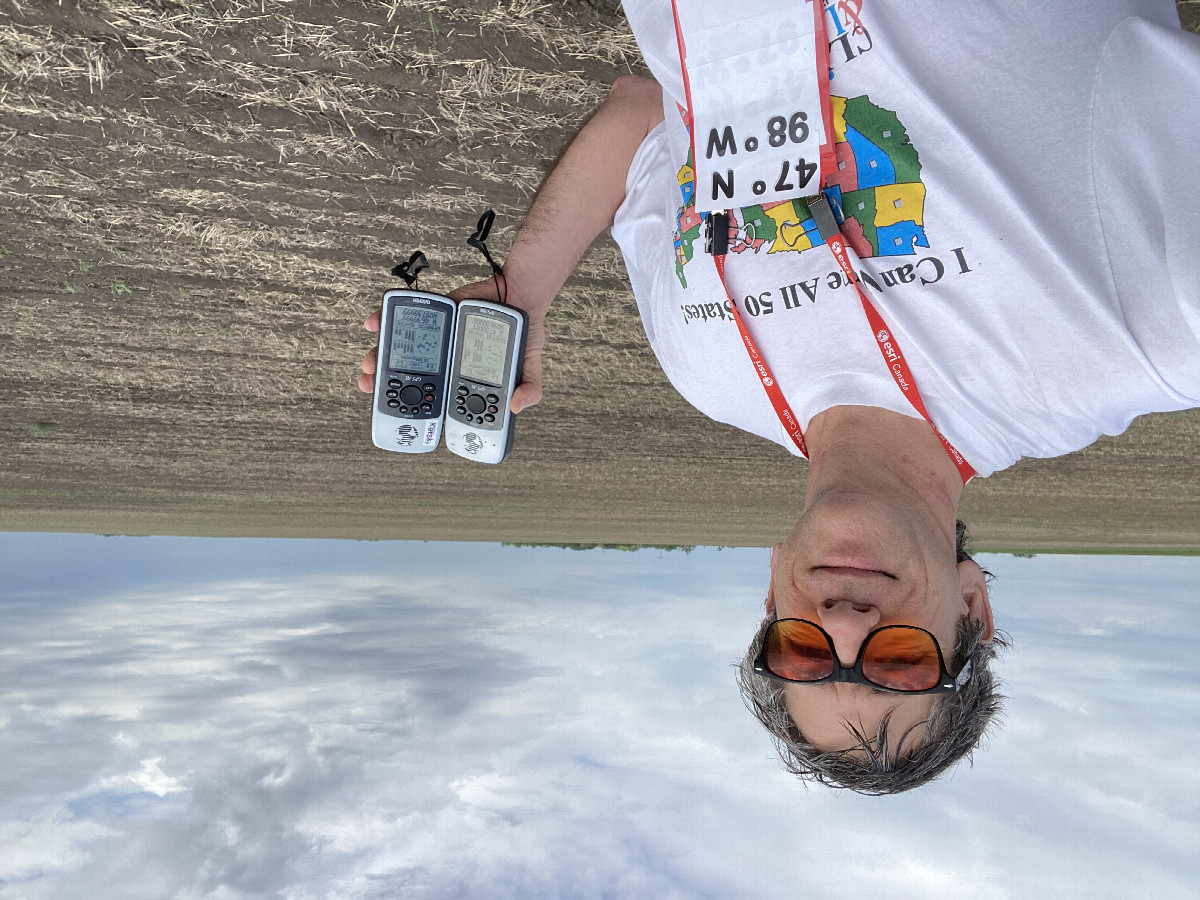
Joseph Kerski is a geographer with a focus on the use of Geographic Information Systems (GIS) in education. He holds 3 degrees in geography and has served as geographer in 4 major sectors of society, including government, academia, private industry, and nonprofit organizations. In addition to authoring many chapters, articles, and podcasts on GIS, education, space, place, and related topics, he has visited 100s of schools and universities around the world and regularly conducts professional development for educators. His books include Interpreting Our World, Spatial Thinking in Environmental Contexts, Essentials of the Environment, Spatial Mathematics, Tribal GIS, International Perspectives on Teaching and Learning, the GIS Guide to Public Domain Data, and others. But as a lifelong learner, he feels as though he’s just getting started and thus actively seeks mentors, partners, and collaborators.
Elaine is a geographer at the USGS. She studied typography in grad school, and was an applied researcher in multi-scale cartography at USGS before becoming The National Map liaison to North and South Dakota.






.png)













In lacus lacus, ornare sit amet sapien vitae, congue egestas augue. Vivamus eros elit, efficitur et rhoncus sed, euismod ut massa. Nunc dictum ac dui consequat viverra.
Lorem ipsum dolor sit, amet consectetur adipisicing elit. Vero voluptas assumenda eligendi perferendis! Aspernatur, praesentium rem! Dolore ut blanditiis eaque maiores similique asperiores consequatur, voluptatibus ab doloremque quia unde rem. Lorem ipsum dolor sit, amet consectetur adipisicing elit. Esse sit quidem dignissimos nemo, tempora modi quas repellat aspernatur, repudiandae illo, deleniti dolores hic voluptate placeat.
The co-chairs will use this opportunity to open up the 2024 Geospatial Summit. We'll also take care of any housekeeping and announcements including information on sponsor door prizes and the Imagery Challenge.
The first USGS topographic maps in 1884 started as hand-engraved copper plates, and in the early 1900s, relief was hand-shaded. By the 1960s, maps were scribed on mylar sheets, labels were applied letter by letter, and technicians field-verified map features. Since 2009, maps are made using GIS software with remotely sensed data, produced on a predefined grid and updated every three years. The 2022 release of topoBuilder allows users to skip the three-year cycle and create custom topographic maps with the latest available data from The National Map centered anywhere in the U.S. and territories.

Elaine Guidero
U.S. Geological Survey
Our sponsors/exhibitors are an important part of the Summit! We invite you to take this time to speak with them. Ask questions, see what services they provide and exchange contact information to continue conversations after the Summit!
Artificial intelligence (AI) is accelerating digital transformation at unprecedented speeds, poised to impact everything we do and help solve complex challenges. The Geospatial Technology industry is already adapting and seeing changes in project requirements creating a world of GeoAI. While this rapid transformation may seem unsettling, numerous opportunities exist to leverage technology for critical infrastructure. While appreciating AI's power, it’s important to distinguish geospatial technology and AI individually and the growth of the GeoAI industry. GIS is a powerful tool that enables visualization, data analysis, designing data structures, and providing decision-making frameworks. On the other hand, AI provides a platform for big data analysis and high-end computing processing that supports the fast deployment of AI models, reducing the time and effort required for manual feature extraction. Combining the two to form GeoAI enhances the accuracy, efficiency, and speed in the computation of various applications and geo-visualization. GeoAI as a digital transformation technology, along with Generative AI, Digital Twins, Big Data, IoT, Metaverse, Machine Learning, and Immersive Technologies like AR/VR, Automation & Robotics, Blockchain, Cloud, and SaaS, have revolutionized the way our industry operates. Together, these technologies enable robust digital ecosystems capable of driving efficiency, scalability, and innovation across sectors.

Eric Abrams
GeoDecisions
Discover how you can collect, map, analyze, and communicate the result of your field investigation using easily configurable tools including ArcGIS Survey123, ArcGIS Online, instant apps, dashboards, and storymaps in this hands-on, engaging workshop designed to give you confidence and skills that you can use right away.

Joseph Kerski
Esri
Did you know as a GIS data steward in North Dakota you may be providing data to national mapping tools? North Dakota DOT and DEQ both use EJScreen as a first-cut environmental and socioeconomic screening tool. EJScreen is the U.S. Environmental Protection Agency’s environmental justice screening tool. It provides users with nationally consistent datasets and an approach for examining environmental and socio-economic factors. Environmental Justice is the fair treatment and meaningful involvement of all people, regardless of race, color, income, national origin, disability, or Tribal affiliation in the government decision making process and activities that have a potential to affect human health and the environment. This means that people are protected from adverse health and environmental affects and have equitable access to a healthy environment in which to live, play, work and grow. There are things that users in North Dakota, or any rural state, should be aware of when using EJScreen. This awareness does not diminish the usefulness of the tool, but rather enhances your ability to make the best use of the incredible amount of data presented in EJScreen. The EPA will provide an overview of EJScreen; the DEQ will demonstrate the tool for their unique processes; DOT will provide an example of how they applied the tool to transportation projects, and in general, things to be aware of when using “nationally consistent” modeled data within rural areas like North Dakota. Finally, the presenters will demonstrate how to add datasets that are on the ND GIS Hub into EJScreen.

Patricia Winn
NDDOT
GIS Scripts are useful to automate processes to save time and repeat processes with consistent results. This presentation will showcases how python programming has been used in ArcGIS Online Notebooks and ArcGIS Pro Python Notebooks along with uses of ArcGIS Arcade within ArcGIS Online Popups and ArcGIS Pro field calculations.
Lucas Rengstorf
AE2S
What is a conference without food! Pick up your box lunch and find a place to sit or stand if you are tired of sitting. If during registration you indicated any allergy or other food requirements, those should have been addressed.
The geospatial industry has been rapidly changing and expanding and will likely continue doing so. In this panel discussion which includes opportunities for questions from the audience, we’ll hear the panelists from the geospatial industry, government, and education describe the hard and soft skills necessary to thrive now and into the future. If you are looking to move into some aspect of the geospatial industry, are looking for ideas on how to move upward in the industry or are looking for ways to grow in your current role, this panel is for you. If you are already in the geospatial industry and are looking to hire, you will likely come away with valuable insight.

Bob Nutsch
State of North Dakota

Gregory Vandeberg
Department of Geography and GISc., University of North Dakota
McKenzie County recognized the possibilities for streamlining its process for managing approach permits using GIS. Having relied on a paper-based process for many years, the County wanted to eliminate duplicate data entry, improve the way information was gathered, stored and tracked, and provide staff, contractors and the public with a more user-friendly experience. Join this session to see how the County transformed its workflow, using Survey123 forms and ArcGIS solutions to manage approach permit applications with greater ease, speed and accuracy than before.

Michael Nordquist
Pro-West & Associates, Inc.
Bonnie Foster
McKenzie County
Situated along Virginia’s southeastern coast, the Hampton Roads region is a historic hub for coal storage and transportation. When inhaled, pollutants like coal dust can cause respiratory and cardiovascular issues, raising concerns among community members about the potential human health risks associated with coal dust and other particulate matter (PM) pollution. This project determined the feasibility of using NASA Earth observations—specifically Terra/Aqua MODIS and CALIPSO CALIOP—to measure air particulates, map their distribution across the region, and identify air quality trends over time.

Marilee Karinshak
National Aeronautics and Space Administration
The U.S. Environmental Protection Agency (EPA) announced that the Lead and Copper Rule Revisions (LCRR) would go into effect with the intention to identify and replace all lead pipes in communities across the nation to reduce lead in drinking water. The North Dakota Department of Environmental Quality is administering the program. A GIS centric methodology was used throughout the entire project process.

Ethan Tschosik
Interstate Engineering
AE2S GIS Services purpose is to use GIS to support AE2S' mission and vision “Empowering People and Enhancing Lives”. We do this by providing extreme client services and developing GIS solutions to help communities' and infrastructure projects. In this presentation we will discuss areas AE2S GIS Services is focused on being best at and how we provide value to you the client.

Lucas Rengstorf
AE2S
Our sponsors/exhibitors are an important part of the Summit! We invite you to take this time to speak with them. Ask questions, see what services they provide and exchange contact information to continue conversations after the Summit!
The CIP tool discussed in this presentation helps decision makers see asset inventory results summarized by pressure zones, size, or material within maps and graphs. Along with additional tabs to help determine areas to prioritize replacement with map and graphs showing remaining useful life, and risk results. The CIP tool is iterative and interactive, the Project Planning tab allows the user to test different project scenarios. The results of using the CIP tool allows key project stakeholders to determine areas to prioritize projects, GIS users to identify gaps in their data, and summarize asset inventories that meet state funding requirements.
Lucas Rengstorf
AE2S
The North Dakota Dept of Water Resources has always had a very robust data collection operation, but our data holdings have grown substantially in the years since the last Geospatial Conference and are literally growing by thousands of data points every day. This presentation will briefly review updates to the DWR’s primary data collections in the areas of remotely sensed water, atmospheric and geologic data, survey data, LiDAR, aerial imagery, and map resources.
Whether you are new to ArcGIS Experience Builder or have you been building experiences for years, this session will touch on some of the tips and tricks to help you be more efficient in creating your web applications.
Harmful Algal Blooms (HABs) can degrade the water quality of lakes and streams. HABs can block sunlight, lower oxygen levels, and may produce toxins. Industrial and domestic waste and fertilizer runoff can enrich nutrients for algae and lead to HABs. Chlorophyll-a (Chl-a) is a significant indicator for tracking HABs and has been monitored increasingly using remote sensing techniques. Chl-a water samples were collected and analyzed in summer and fall of 2023 from five lakes including Fordville Dam Recreation Area, Larimore Dam Recreation Area, Homme Dam Recreation Area, and South and North Golden Lakes. Six multi-band combination indexes of Sentinel-2 and Landsat 8 remote sensing satellite imagery were compared with in-situ Chl-a concentrations. Chl-a concentrations had a strong correlation with the Normalized Difference Chlorophyll Index (NDCI). Getis-Ord Gi* Hotspot analysis was used to identify trends and patterns of the NDCI values in the lake. Chlorophyll hotspots in South and North Golden lakes were mostly located in the shallow edges and migrated from north to south over time. Chlorophyll hotpots in the reservoirs migrated from the influent tributaries to the remaining parts of the lake over the sampling period.

Gregory Vandeberg
Department of Geography and GISc., University of North Dakota
Have you always defaulted to the ArcGIS Survey123 Connect designer because you didn't think the web designer could handle it? Now is the time to take a closer look at the ArcGIS Survey123 web designer interface to check out the new features added to make designing complex surveys even easier. While it doesn't do everything, it does a lot more than it used to. Come see what some of the features are to help you with your next ArcGIS Survey123 design.
Pop-ups in a web map or web application provide essential context for the user to learn about the data they've clicked on. This session will cover the ins and outs of pop-ups in the ArcGIS Online map viewer along with some recently released capability updates.
Agencies in our industry are constantly collecting, storing, and Analyzing data from various sources. However, integrating this data between systems without resorting to custom code or ad hoc processes can be a significant challenge. Often, policies, procedures, and people can act as barriers to effective data integration and governance. This session will demonstrate the critical role that a data fabric framework plays in overcoming these challenges, bringing data and systems together through culture, GIS, data management, and business processes.

Eric Abrams
GeoDecisions
There are many benefits updated hydrography can provide that are essential to a wide range of critical applications including natural resources, infrastructure management, agriculture, planning and water resource management. Elevation derived hydrography from lidar increases the accuracy of water features flowing across the landscape. Integrating culvert inventories and lidar DEMs, stream networks can be updated to represent true concentrated flow of water. Elevation derived hydrography can be used to update inventories of the state 24k Hydrography or the USGS National Hydrography Dataset (NHD). This presentation will review lidar derived watershed hydrography examples and potential for future opportunities will be explored.
Tyler Kaebisch
Ayres Associates
After a day of presentations and information, by now your brain is probably getting overloaded from all of the content! Here's your chance to cool it down, but don't get a brain freeze! We plan to offer ice cream with toppings, and root beer floats, along with non-dairy and sugar-free options. This will also be the time when we'll find out who did the best with the Imagery Challenge.
We'll begin the day with reminders and announcements including any changes to the agenda.
Join Joseph Kerski for a lively discussion focused on societal forces, skills, and trends in GIS, the implications for what and how we must teach and learn GIS in the future, and advice on how you can plan your own pathway forward.
Joseph Kerski
ESRI

Joseph Kerski
Esri
Our sponsors/exhibitors are an important part of the Summit! We invite you to take this time to speak with them. Ask questions, see what services they provide and exchange contact information to continue conversations after the Summit!
In this session, we will utilize some of the ESRI Online web apps to do more with your maps. Developer experience is unnecessary to build great applications. We will also take a look at available resources to get you on a fast track to using these products.

Stephanie Weiand
NDDOT
Drought-associated water shortage is a complicated hazard, and extreme weather and climate events severely impact any society's agricultural, ecological, and socio-economic activities. This work aims to develop and evaluate a combined drought index for North Dakota using high-resolution data from Landsat to evaluate the Spatiotemporal distribution of drought events and intensities for a better understanding of agricultural drought and water resource stress at a micro-scale from 2000 - 2023. In this study, we calculate the main components of the water balance and link them with information on vegetation growth and drought in North Dakota. We estimated monthly precipitation, evapotranspiration, water balance, and vegetable and drought Indices. The soil moisture index and the widely used vegetation condition index (VCI) for drought monitoring were analyzed to assess extreme drought events. In addition to VCI, we used meteorological indicators of land surface temperature (LST) to evaluate the temperature condition index (TCI) and vegetation health index (VHI) and assess the temporal trend of vegetation health and its impacts on drought events. Results were compared with remote-sensing-based drought indices, such as TCI and VHI. It was observed that the VCI and VHI, which combined vegetation and meteorological information and the Moisture stress index (MSI), had a stronger correlation with precipitation data than the NDVI-derived VCI. We also observed a significant decrease in monthly precipitation over major crops of the region during these intense drought years. Compared with drought indices, the long-term agricultural drought situation reveals a distinctly good agreement among all agricultural drought indices, as the TCI, MSI, VHI, and precipitation anomalies also decreased significantly.

Mbongowo Mbuh
University of north dakota
Throughout the last couple of decades geographic information systems (GIS) use has been expanding in the South Dakota government, however, there were some early pioneers who used GIS for land cover and soils mapping as early as the mid 1970’s. In the past GIS technologies and those who use them were thought to only be mappers. However, we now recognize that GIS is much more than just desktop software and mapping, it has grown to a true GIS Enterprise infrastructure recognized as being a major integral system within state government that is touching every aspect of government. This progress is not without some spectacular false starts and roadblocks, as well as some major technological advancements. During this talk we’ll walk through some of this history and then move forward to the latest enhancements for the current state-of-the-state GIS and our future vision.

Mark Freund
State of South Dakota
Join us to explore ways that indoor mapping can help improve public safety response. With Americans spending over 85% of their time indoors, getting indoor data into the right hands is vital. From collection of over 5 buildings a day to tools for first responders, we will look at tips and techniques to help decrease response times, improve situational awareness, and save lives. Giving call takers, dispatchers, fire, EMS, and police the ability to know where an incident is when someone says “Outside of room 101” can save time when seconds matter!
Climate change and global warming have contributed to extreme weather events and patterns, including severe flooding, earthquakes, wildfires, and drought. Drought happens to be the deadliest catastrophic event around the world. Drought's impact on ecosystems and local communities has been increasing in many parts of the world, including the United States and, most importantly, the corn Belt, which also happens to be the country's food basket. Understanding drought prediction and mitigation can be investigated through drought indices. The Standardized Precipitation Index (SPI) is considered the most reliable in this study. It is used in this study to present the critical identifier in diagnosing extreme precipitation events during multiple periods. It is also comparable to various landscapes across a region and is simple to use concerning its calculation process. This study focuses on the Midwest Corn Belt Region of the United States between the climate record from 2000-2023. This study is designed to understand precipitation regimes and their impact on agricultural production in various landscapes across the corn belt region of the United States. Results for the study area showed drought affecting at least portions of the Corn Belt 2000, 2001, 2002, 2003, 2006, 2009, 2011, 2012, 2013, and 2018 with areas characterized as being mild, moderate, severe, or extremely dry. Our analysis shows that climate change has undoubtedly resulted in a temperature rise, exacerbating the frequency and severity of heat waves in many parts of the United States, including the Corn Belt.

Victor Araya
University of North Dakota
This presentation focuses on the simple and efficient communication techniques that the AE2S GIS team uses to transfer assignments and workflows using programs like ArcGIS Pro and Microsoft Teams.
Hope Records
Advanced Engineering & Environmental Services (AE2S)
As part of NDDOT’s Transportation Management Center and I-29 SMART Corridor project, Bolton and Menk GIS staff relied on Python and ArcGIS Online (AGOL) Dashboards to analyze numerous datasets and present those results. The goal of the project was to study the benefits of implementing a Statewide Transportation Management Center (TMC) and/or a SMART (Safety, Mobility, Automated, Realtime, Traffic management) Corridor. GIS staff led the effort to evaluate 5 years of historic data including crashes, weather, speed, and construction projects/511 events. By determining the impacts on traffic and the existing transportation network, Bolton and Menk were able to assess the needs and opportunities for a TMC and/or SMART corridor. The result was a collection of ten AGOL dashboards and dozens of PDF figures for internal QA/QC and external deliverables. This presentation will highlight the general Python methodology, GIS deliverables, as well as lessons learned.
Tyler Johnson
Bolton & Menk
Involving the whole community in mitigation planning isn’t a new concept, however, the North Dakota Department of Emergency Services – Division of Homeland Security Planning section is taking mitigation planning to the next step. Utilizing GIS based data tools to guide mitigation planning data collection and targeting outreach efforts has aided our planning to be more effective and inclusive. Collecting information while identifying underserved populations and opportunities for resiliency building allows emergency managers and plan developers to provide focused attention on communities that may need it the most. Integrating this GIS Data into other emergency management efforts such as recovery efforts and response planning allow for a better overall outcome allowing our communities to continue thriving and build resilience.
2024 marks the 100th anniversary of the North Dakota Highway Map. To celebrate, the North Dakota Department of Transportation (NDDOT) is publishing monthly blogs that illustrate the history and changes of the map. Join the NDDOT as they show you how ESRI story maps are used to guide readers down memory lane to learn more about the history of the State Highway Map.
The co-chairs will use this opportunity to wrap things up, including providing some time for fielding questions and suggestions. But don't leave quite yet. We plan to have the drawing for sponsor door prizes!

.png)
.png)